view
Visualization for blockchain data.
The workflow for the visualization:
Fetch the data using classes from
dataVisualize the data using bokeh lib
All data is cached and can be accessed from the View
Examples
Preliminary setup
from datetime import datetime
from bokeh.io import output_notebook
from web3cat.view import View

# for python notebooks
output_notebook()
Example 1
v1 = View(token="DAI", start=datetime(2022, 6, 1), end = datetime(2022, 10, 30))             .total_supply()             .balance(["0x5d3a536E4D6DbD6114cc1Ead35777bAB948E3643", "0x467194771dAe2967Aef3ECbEDD3Bf9a310C76C65"])
v1.show()

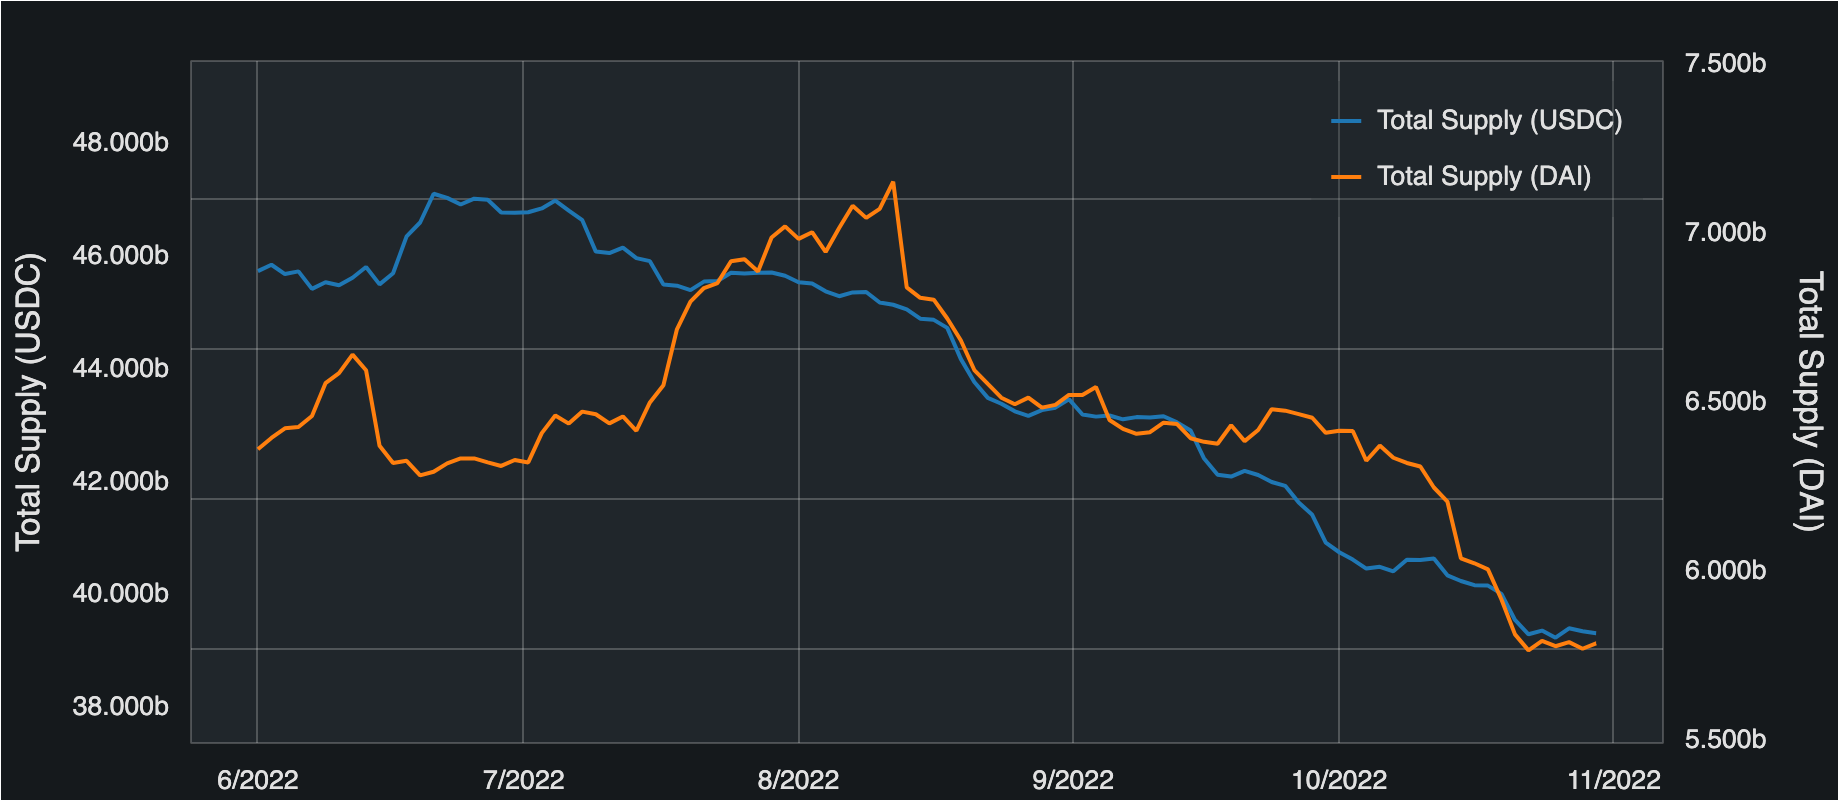
Example 2
v2 = View(start=datetime(2022, 6, 1), end = datetime(2022, 10, 30))             .total_supply(token="USDC")             .total_supply(token="DAI")
v2.show()
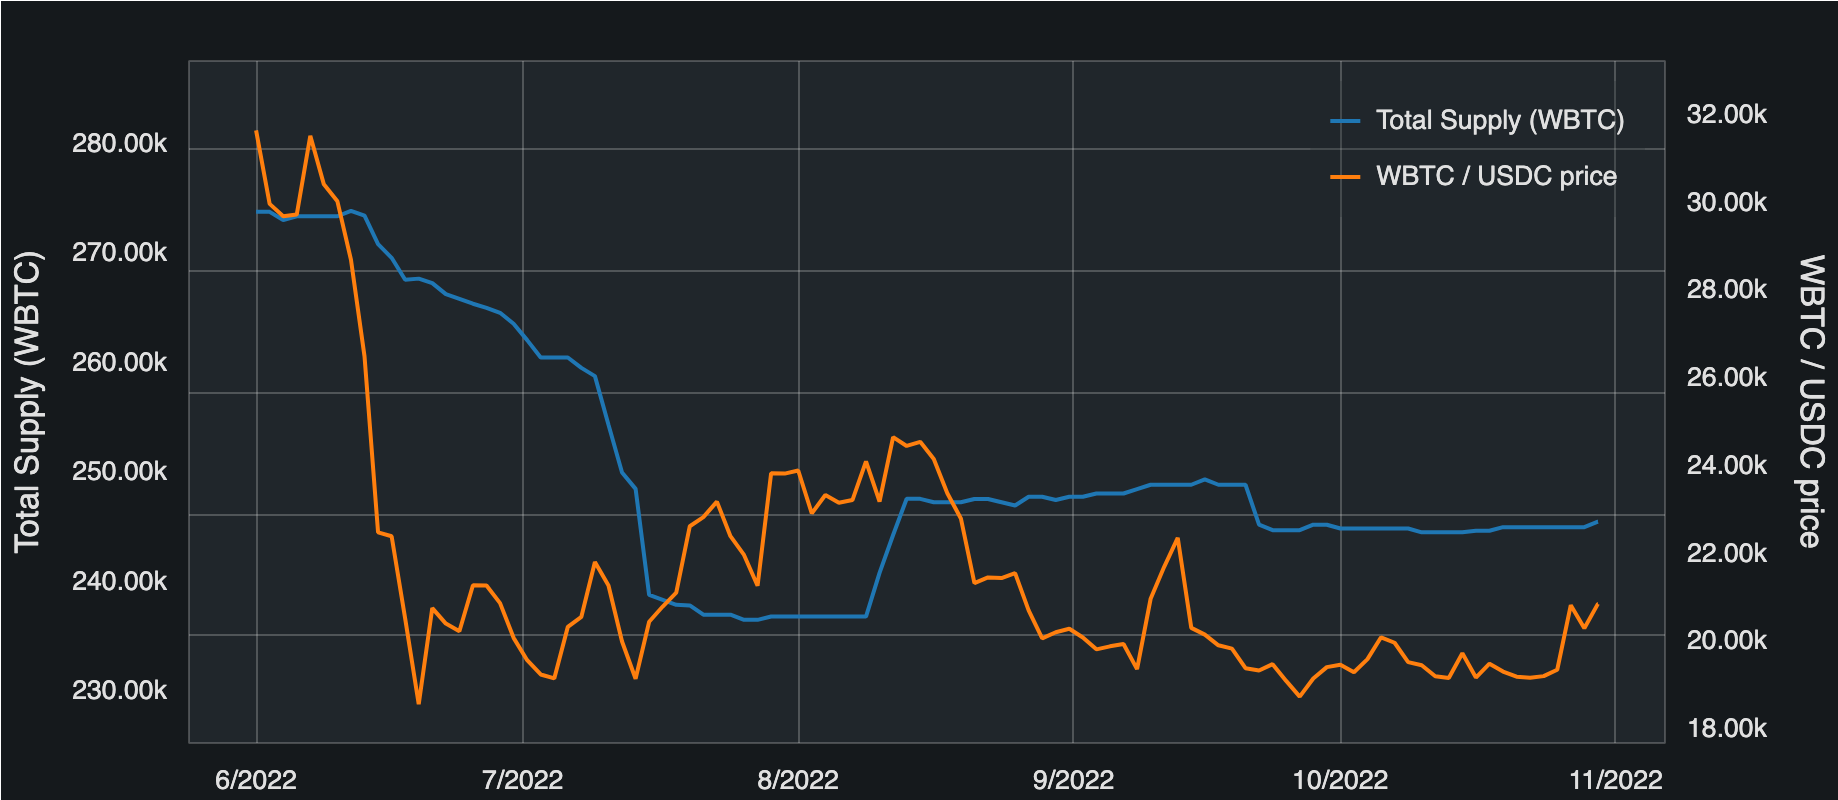
Example 3
v3 = View(token="WBTC", start=datetime(2022, 6, 1), end = datetime(2022, 10, 30))             .total_supply()             .chainlink_prices(base_token = "USDC")
v3.show()
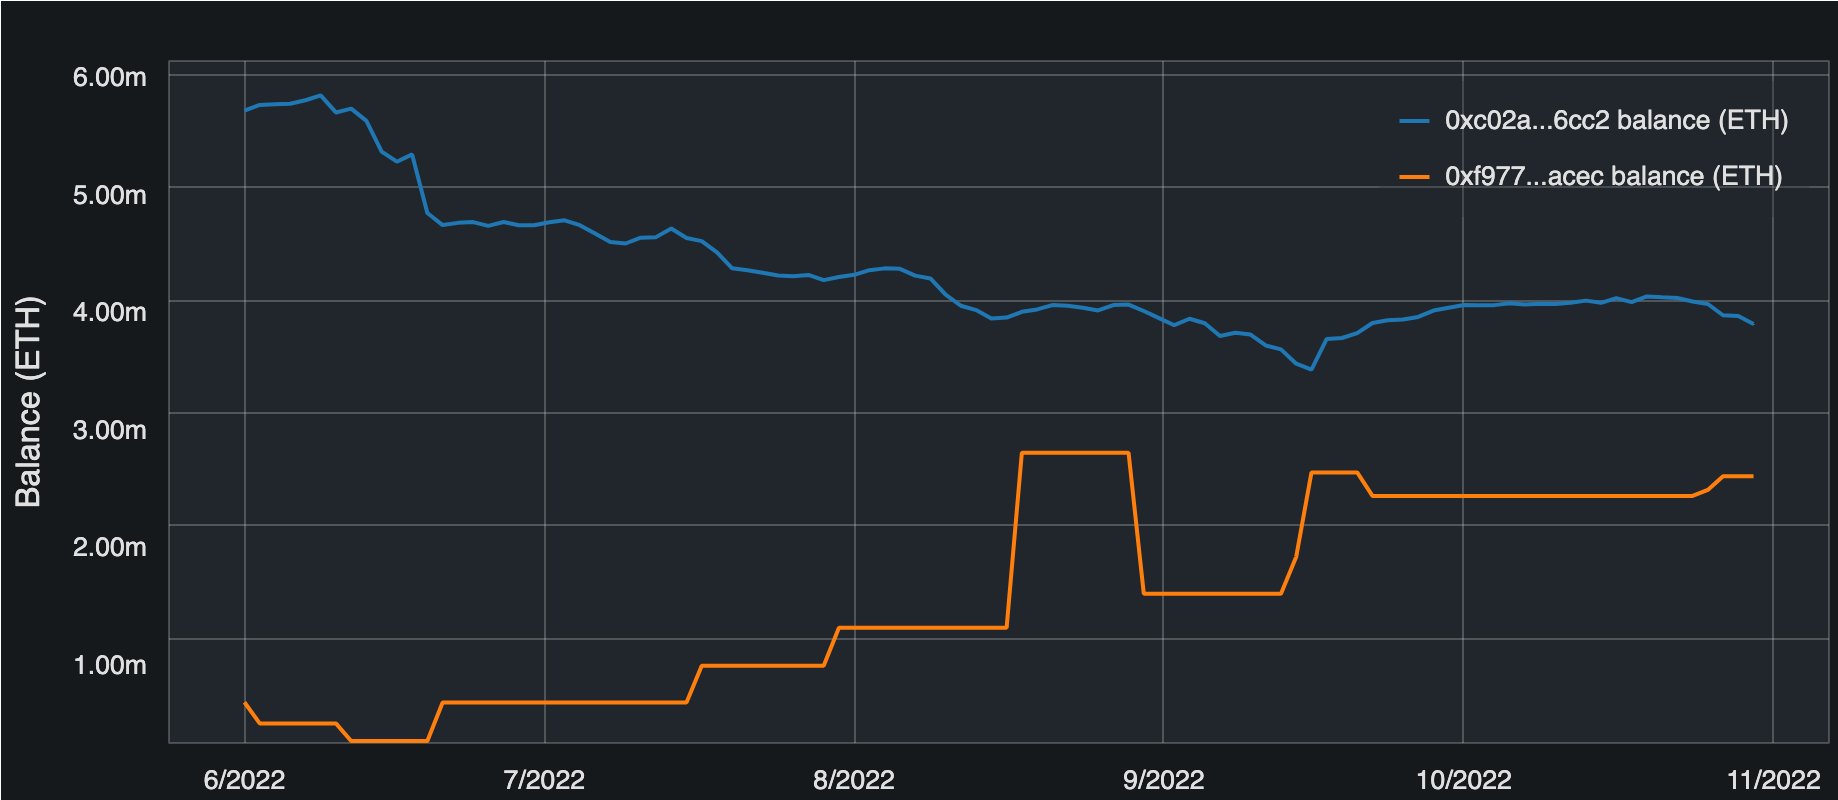
Example 4
v4 = View(token="ETH", start=datetime(2022, 6, 1), end = datetime(2022, 10, 30))             .balance(["0xc02aaa39b223fe8d0a0e5c4f27ead9083c756cc2", "0xf977814e90da44bfa03b6295a0616a897441acec"])
v4.show()
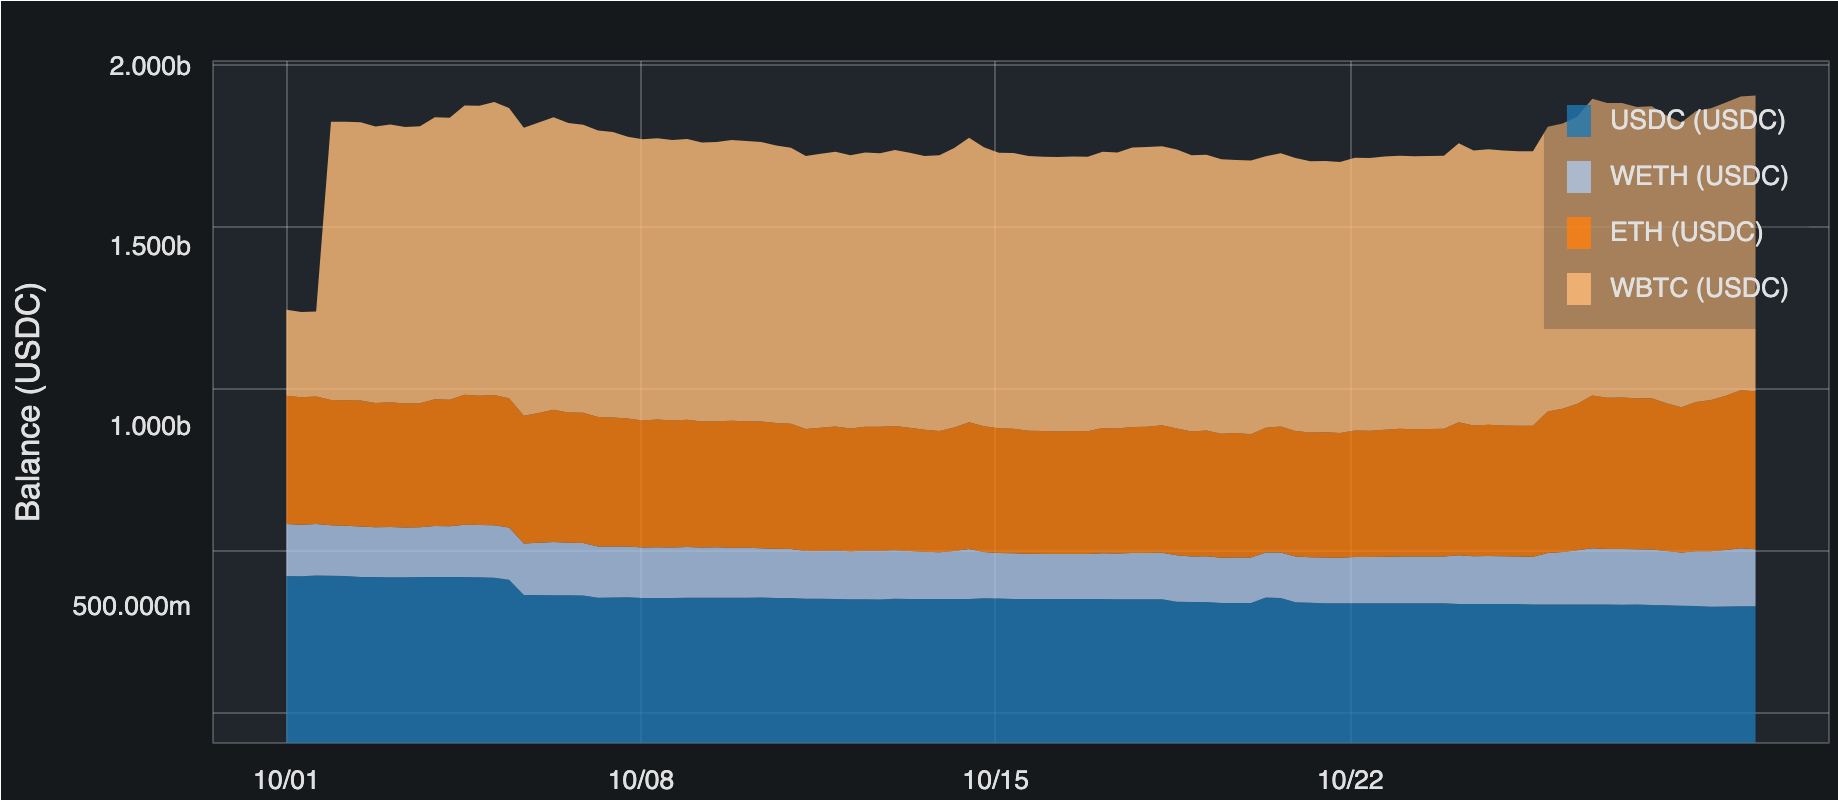
Example 5
addresses = [
"0x78605Df79524164911C144801f41e9811B7DB73D",
"0xBF72Da2Bd84c5170618Fbe5914B0ECA9638d5eb5",
"0x8EB8a3b98659Cce290402893d0123abb75E3ab28"
]
tokens = ["USDC", "WETH", "ETH", "WBTC"]
base_tokens = ["USDC", "WETH"]
v5 = View().portfolio_by_token(
addresses = addresses,
tokens = tokens,
base_token = "USDC",
start=datetime(2022, 10, 1),
end=datetime(2022, 10, 30),
numpoints=100
)
v5.show()
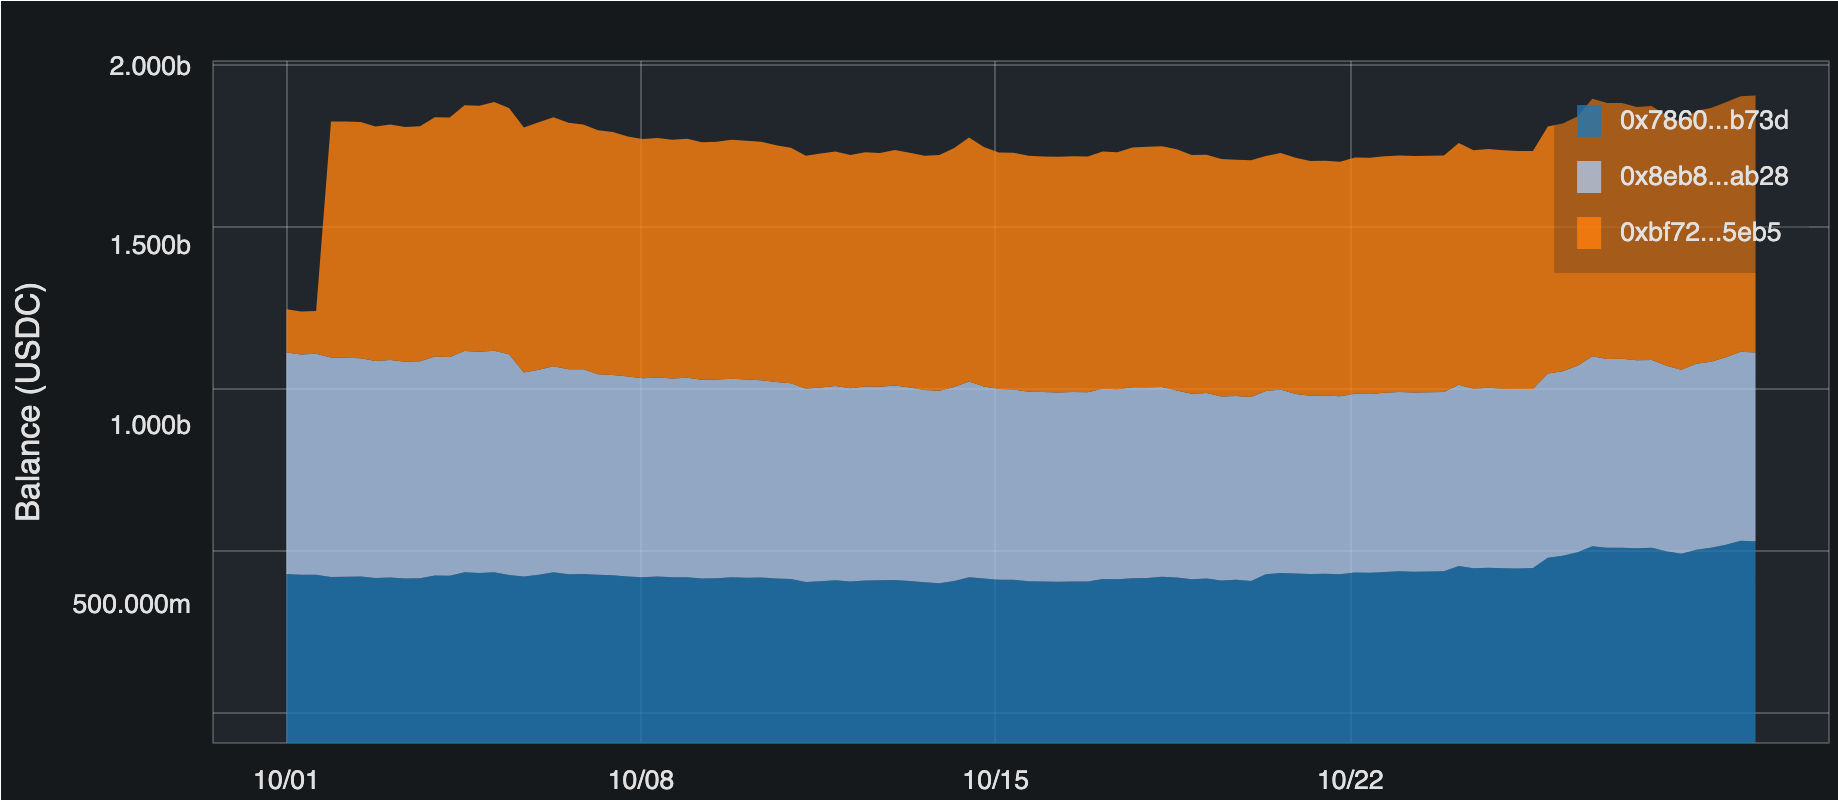
v6 = View().portfolio_by_address(
addresses = addresses,
tokens = tokens,
base_token = "USDC",
start=datetime(2022, 10, 1),
end=datetime(2022, 10, 30),
numpoints=100
)
v6.show()
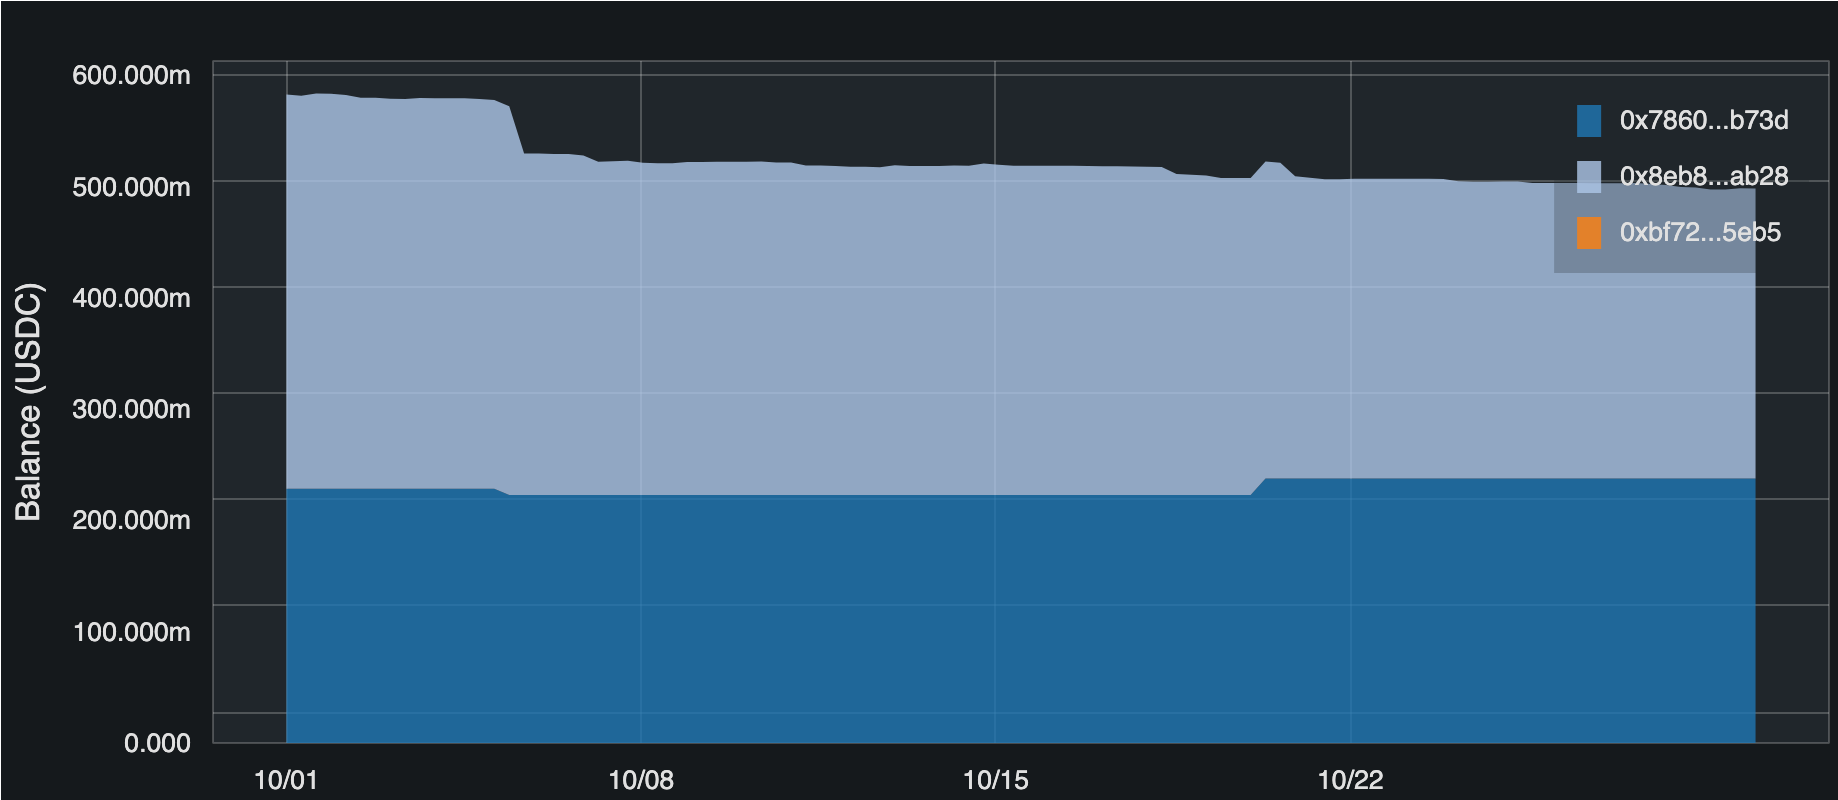
v7 = View().portfolio_balance(
addresses = addresses,
base_token = "USDC",
start=datetime(2022, 10, 1),
end=datetime(2022, 10, 30),
numpoints=100
)
v7.show()
Example 6
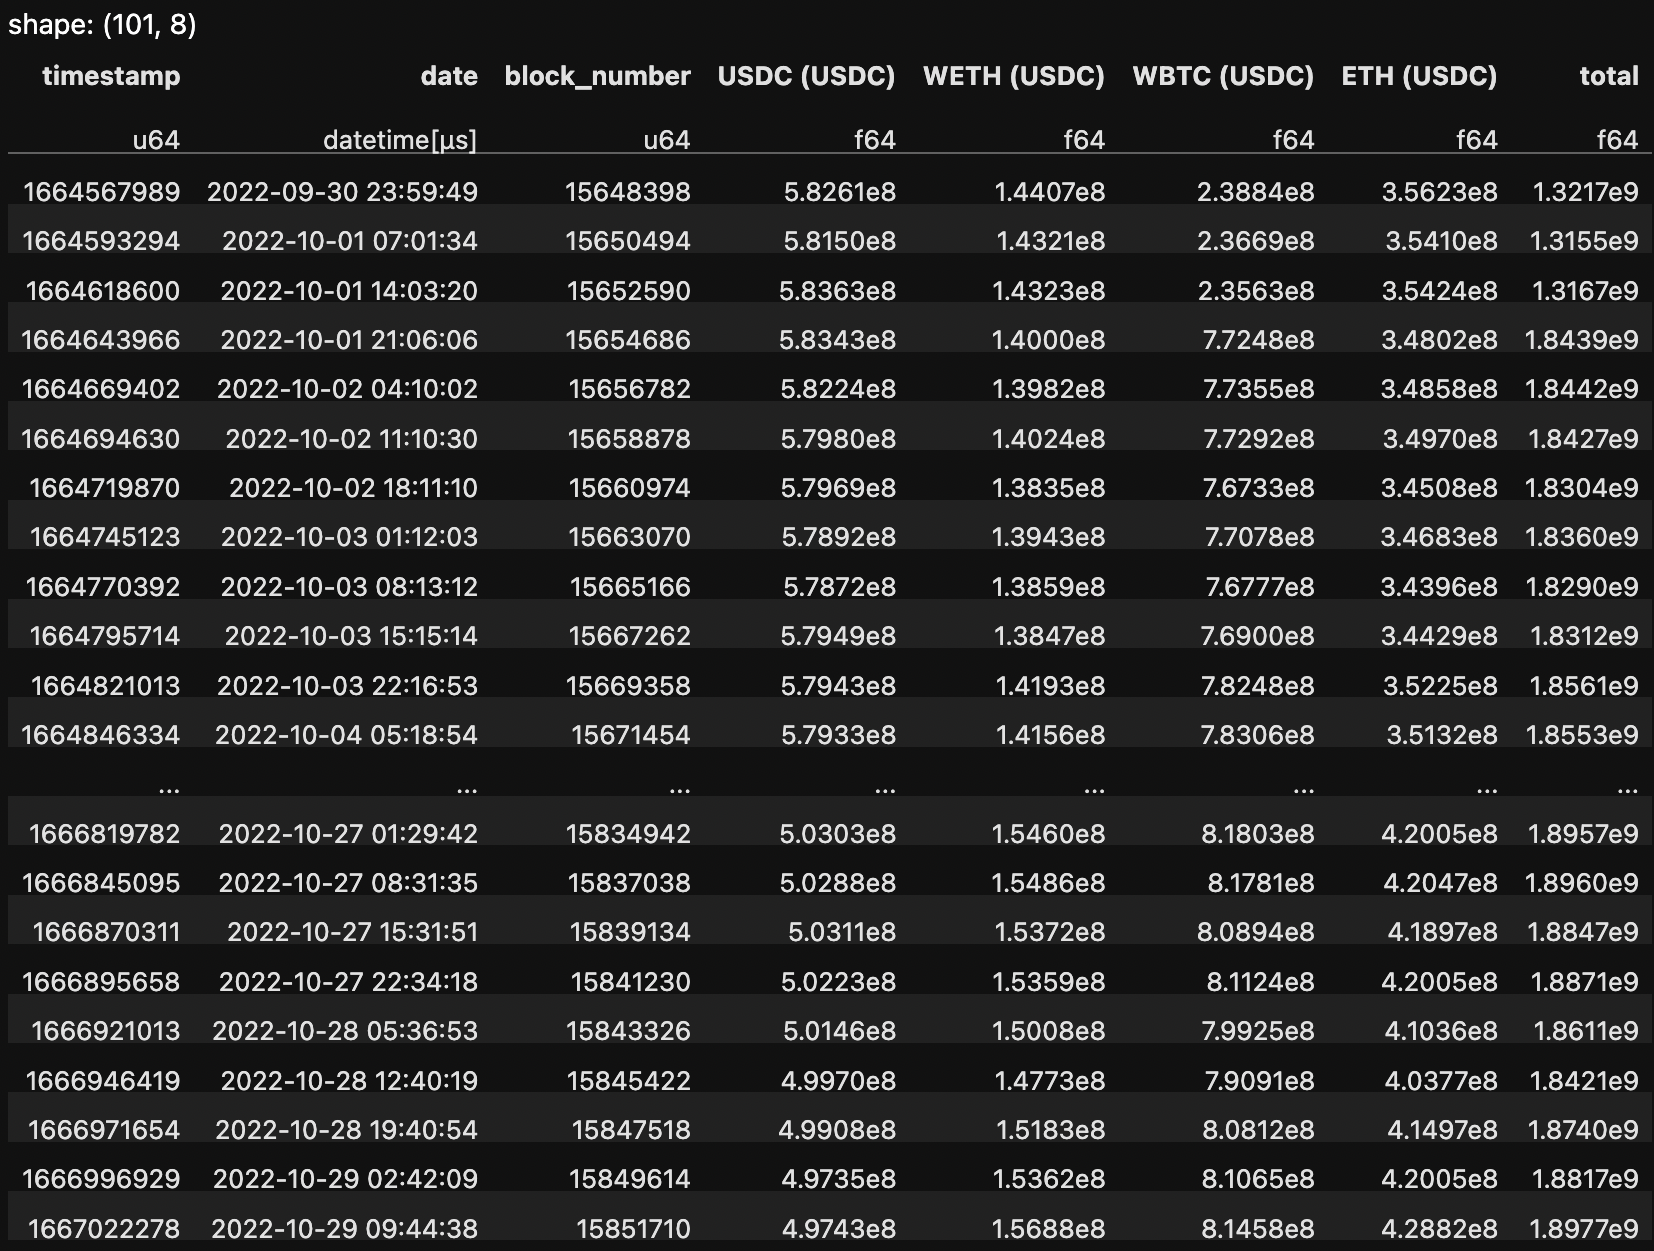
v6.get_data(0).breakdown_by_token("USDC")
- class web3cat.view.View(**kwargs)
Bases:
objectVisualization of the blockchain data
- Parameters:
**defaults – default values for all methods called
**common_defaults – Common defaults for all graphs. Currently it’s
x_axis_nameandy_axis_name.**fig_args – the arguments for the
bokeh.plotting.Figure**core_args – the arguments for the
fetcher.core.Core
- property figure: Figure
bokeh.plotting.Figurefor the view.
- total_supply(token: Optional[str] = None, start: Optional[Union[int, datetime]] = None, end: Optional[Union[int, datetime]] = None, numpoints: Optional[int] = None, **kwargs) View
Historical total supply of the ERC20 tokens
- Parameters:
token – ERC20 token
start – start timepoint
end – end timepoint
numpoints – number of points in between
kwargs – common_defaults, see
View
- chainlink_prices(token: Optional[str] = None, base_token: Optional[str] = None, start: Optional[Union[int, datetime]] = None, end: Optional[Union[int, datetime]] = None, numpoints: Optional[int] = None, **kwargs)
Chainlink prices.
- Parameters:
token – Numerator in the price
base_token – Denominator in the price
start – start timepoint
end – end timepoint
numpoints – number of points in between
kwargs – common_defaults, see
View
- balance(address: Optional[Union[str, List[str]]] = None, token: Optional[str] = None, start: Optional[Union[int, datetime]] = None, end: Optional[Union[int, datetime]] = None, numpoints: Optional[int] = None, **kwargs)
Balances of ERC20 token.
- Parameters:
address – an address or the list of addresses
token – ERC20 token
start – start timepoint
end – end timepoint
numpoints – number of points in between
kwargs – common_defaults, see
View
- portfolio_by_address(tokens: Optional[List[str]] = None, base_token: Optional[str] = None, addresses: Optional[List[str]] = None, start: Optional[Union[int, datetime]] = None, end: Optional[Union[int, datetime]] = None, numpoints: Optional[int] = None, **kwargs) View
Portfolio of ERC20 tokens, breakdown by address.
Note
It can be called only once per the
View- Parameters:
tokens – a list of token holding that needs to be analyzed
base_token – all values will be aggregated in this token
start – start timepoint
end – end timepoint
numpoints – number of points in between
kwargs – common_defaults, see
View
- portfolio_by_token(tokens: Optional[List[str]] = None, base_token: Optional[str] = None, addresses: Optional[List[str]] = None, start: Optional[Union[int, datetime]] = None, end: Optional[Union[int, datetime]] = None, numpoints: Optional[int] = None, **kwargs)
Portfolio of ERC20 tokens, breakdown by token.
Note
It can be called only once per the
View- Parameters:
tokens – a list of token holding that needs to be analyzed
base_token – all values will be aggregated in this token
start – start timepoint
end – end timepoint
numpoints – number of points in between
kwargs – common_defaults, see
View
- portfolio_balance(base_token: Optional[str] = None, addresses: Optional[List[str]] = None, start: Optional[Union[int, datetime]] = None, end: Optional[Union[int, datetime]] = None, numpoints: Optional[int] = None, **kwargs) View
Portfolio of one specific ERC20 token, breakdown by address.
Note
It can be called only once per the
View- Parameters:
base_token – a token tracked for balances
start – start timepoint
end – end timepoint
numpoints – number of points in between
kwargs – common_defaults, see
View
- show()
Fetch the data and output the figure.